
 YouTube
 Apple Podcasts
 Spotify
 Amazon Music
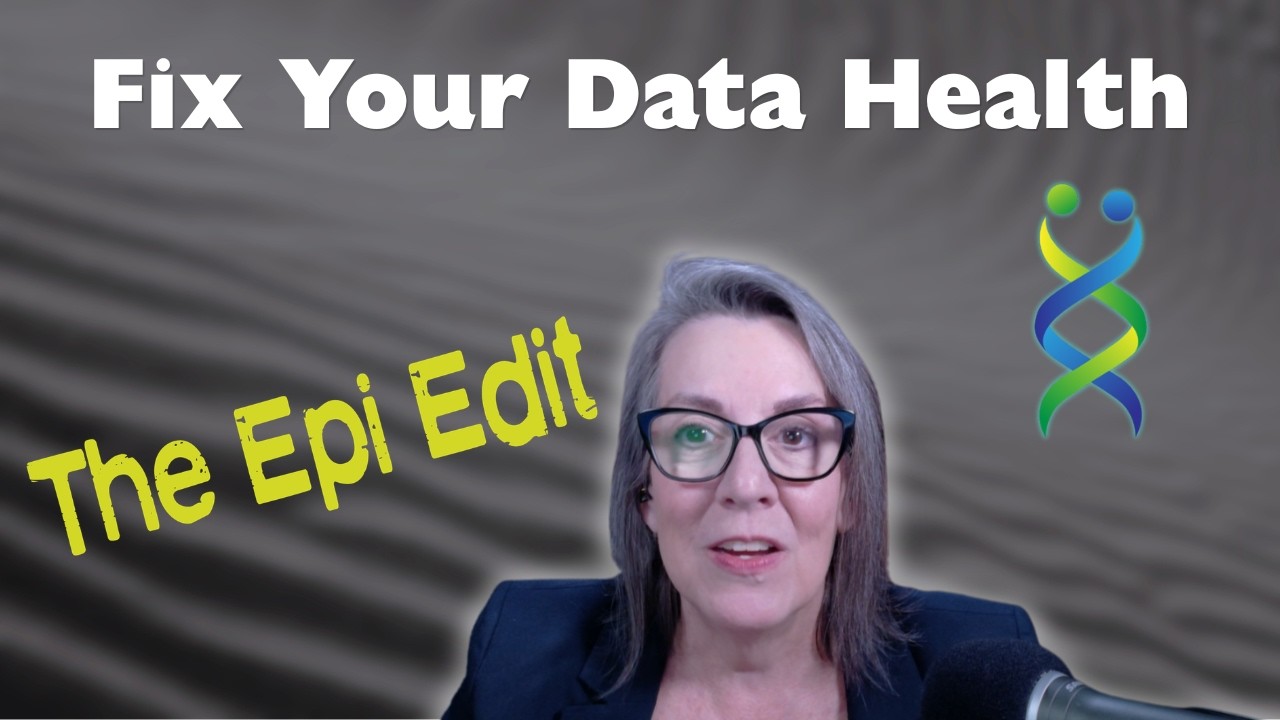
 "Fix Your Data Health" — The Lie of "Average" Cancer Odds (The Epi Edit)
When we are thrown into a health crisis, our brains desperately search for certainty through anchors, maps, timelines, and data. In the United States, the absolute gold standard for tracking population-level oncology data is a public health system called SEER (Surveillance, Epidemiology, and End Results) managed by the National Cancer Institute.
In this episode of The Epi Edit, cancer epidemiologist Dr. Randi Paynter pulls back the curtain on how SEER works under the hood, analyzing its 50-year history tracking cancer trends, its specific regional and metropolitan footprint, and what it intentionally includes and excludes — such as non-melanoma skin cancers and in situ cervical cancers.
Crucially, Dr. Paynter introduces a vital data-literacy framework designed to protect a patient's peace of mind: learning how to analyze the denominator. By contrasting the systemic, geographic, and socioeconomic realities of a rural patient in Montana with an urban patient in the Greater Bay Area of California, this episode demonstrates how broad percentages create mathematical fictions that flatten human experiences and hide critical health disparities. Learn how to ask the right questions in the doctor's office to move past flat averages and toward personalized health advocacy.
In this episode, we discuss:
• The psychological search for certainty and data anchors following a diagnosis.
• What SEER stands for, its funding structure, and its historical role since 1973.
• How representative sampling works across state and metropolitan registries.
• The definitions of Incidence vs. Mortality and Survival in public health data.
• The operational boundaries of data collections: Why minor skin cancers are excluded.
• The basic math of a statistic: Shifting focus from the numerator to the denominator.
• Contrasting human realities: The structural hurdles of rural Montana vs. urban California.
• How a flattened denominator masks disparities and advantages simultaneously.
• Slicing the denominator: Using specific variables to drive personalized medicine and self-advocacy.
-- Go to ChangedByCancer.com for show notes and episode links
Connect with the Community:
-- Free Patreon Community Space: https://patreon.com/ChangedByCancer?utm_medium=unknown&utm_source=join_link&utm_campaign=creatorshare_creator&utm_content=copyLink
-- Facebook: https://www.facebook.com/ChangedByCancerPod/
-- Instagram: @changedbycancer
Data Systems & Historical Context:
-- National Cancer Institute SEER Program: seer.cancer.gov
-- National Center for Health Statistics: cdc.gov/nchs
Changed By Cancer is hosted by Dr. Randi Paynter, a cancer epidemiologist. This podcast shares personal experiences and systemic issues in healthcare. It is not medical advice. Please consult your own medical team for health-related decisions.
Welcome back to The Epi Edit. I’m your host, Dr. Randi Paynter.
When you or someone you love receives a cancer diagnosis, the world instantly spins sideways. In a single afternoon, your entire reality is rewritten. The language changes, the stakes change, and your daily schedule is replaced by a dizzying calendar of scans, appointments, and consultations.
And almost immediately, human nature kicks in. When we are thrown into a crisis, our brains desperately start searching for certainty. We look for anchors. We want a map, a timeline, a definitive answer to the unknown. And in the modern world, the way we seek that certainty is through data.
You find yourself sitting up late at night, staring at the blue light of a computer screen, or looking at the floor in a quiet doctor's office, asking the big, heavy, existential questions: How common is this condition? What exactly is going to happen next? What do the numbers say about my actual chances?
Now, in medicine, nothing is one hundred percent certain. Every individual body is unique, every genetic profile is distinct, and every biological response to treatment is deeply personal. But we do have highly rigorous, incredibly reliable sources of population data that help us map out the broader healthcare landscape. In the United States, the absolute gold standard for tracking this information is a public health system called SEER.
Today, I want to pull back the curtain on what SEER actually is, how it works under the hood, and most importantly, teach you a critical data-literacy skill that will fundamentally change how you read health statistics forever. I want to teach you how to look past the scary percentages and analyze the denominator.
Let’s start with the tool itself. SEER stands for Surveillance, Epidemiology, and End Results. It is a massive, highly sophisticated data engine funded and managed by the National Cancer Institute. Its data collection teams have been meticulously tracking cancer data in the United States since the beginning of 1973. When you see a graph on the evening news or read a major article about cancer survival rates improving across the country, that information almost always originates from SEER.
But here is a fundamental piece of the puzzle that most people don’t fully realize: SEER doesn’t track every single person across all fifty states. It was never designed to be a universal census of every individual medical chart in America.
Instead, it collects incredibly detailed data from specific regional, state, and metropolitan registries. These locations were chosen very intentionally by public health scientists and statisticians decades ago. The goal was to build a representative sample that mirrors the diverse demographic, geographic, cultural, and socioeconomic makeup of the entire United States population.
For instance, the database includes long-standing, robust, statewide registries from places like Connecticut, Iowa, Utah, Hawaii, and New Mexico—capturing everything from dense suburban pockets to vast, isolated rural landscapes. It simultaneously tracks massive, complex metropolitan catchments, like Los Angeles and the Greater Bay Area here in California. Over the decades, the system has strategically expanded to bring in states like New York, Idaho, Texas, and Massachusetts. Today, it covers roughly 45 to 48 percent of the US population.
These data don't just magically float from a hospital room onto a federal computer screen. Behind those numbers are thousands of dedicated tumor registrars, medical records professionals, and hospital data systems. They are doing the heavy, meticulous administrative work of tracking real human lives, auditing individual treatments, and following up on long-term outcomes over years and decades. It is a monumental public health infrastructure that gives us our baseline understanding of cancer in America.
Inside this massive geographical footprint, SEER tracks all primary malignant—meaning invasive—cancers, as well as in situ, or non-invasive cases. To provide a clear picture of the disease burden, it measures two primary categories:
• Incidence: The system tracks exactly who is getting newly diagnosed, where they live geographically, their age at diagnosis, and how advanced the disease is when it’s first discovered.
• Mortality and Survival: The system measures long-term outcomes over five, ten, and twenty years, which they track in close partnership with the National Center for Health Statistics.
Because SEER has been collecting this information rigorously for over fifty years, it allows epidemiologists like me to look at massive, long-term trends. We can step back and look across decades of data to see exactly how cancer rates are shifting over time. We can see if a specific type of cancer is rising among young adults, or if survival rates for a particular demographic are improving due to a new screening tool. We can slice the data by age brackets, biological sexes, and racial or ethnic groups to find where progress is happening and where the system is falling behind.
But as any researcher will tell you, a data system is only as good as its boundaries. To truly understand a tool, it is just as important to know what it excludes as what it includes.
For example, SEER explicitly does not track non-melanoma skin cancers, like basic basal cell and squamous cell carcinomas. Why is that? Because those specific conditions are incredibly common, highly treatable in a routine outpatient setting, and rarely fatal. If public health agencies tried to track every single minor skin scraping or freeze-procedure across half the country, it would completely overwhelm the public health infrastructure. It would drain valuable resources without providing any meaningful, actionable insights into severe, life-threatening disease burdens.
SEER also excludes in situ cervical cancers for similar systemic and clinical reasons. Knowing these distinct boundaries is vital because it reminds us that data is a curated tool. It helps us understand exactly what the numbers are telling us—and crucially, what they are choosing to omit.
This brings us to the most vital concept I want to leave you with today. This is a framework that will protect your peace of mind and change the way you digest medical information forever: whenever you look at any cancer statistic, you must train your eyes to look straight at the denominator.
Think back to basic middle school math. A statistic, at its core, is just a fraction. You have the numerator on top—that’s the specific event or outcome we are counting, like the number of people who experienced a severe side effect, the number of people who passed away, or the number of people who went into remission. And you have the denominator on the bottom—that is the total group of people being observed over time.
When people are scared, vulnerable, or overwhelmed by a new diagnosis, their eyes naturally skip the math. They focus entirely on the numerator, or they fixate on the final, terrifying percentage blared across a headline. They see an online article that says, "20% of people with this stage of diagnosis experience treatment failure."
The brain immediately internalizes that 20% as a personal lottery ticket. But as an epidemiologist, the very first question I ask when I see a flat percentage like that is: Who exactly is grouped into that denominator?
If a clinical study, a pharmaceutical report, or a news article lumps "All Lung Cancer Patients" or "All Individuals Aged 50 to 60" into one massive, undifferentiated denominator, it completely flattens reality. It treats a highly diverse population as if they are a monolith, ignoring the profound biological, genetic, geographic, and systemic differences within that group. It assumes that every single person inside that denominator is playing the exact same game, under the exact same rules, with the exact same resources. And in our healthcare system, that is never the case.
Let’s look at how that flattening causes real, systemic harm, and how it distorts the truth for individual patients. To understand the danger of a broad denominator, we have to contrast two completely different human realities that often get forced into the exact same mathematical average.
Imagine two patients diagnosed with the exact same stage of the exact same cancer.
Patient A lives in a rural community in a state like Montana. They are miles away from a major city. To see a specialized oncologist, they have to coordinate unpaid time off work, secure childcare, drive many hours – probably across state lines and mountain passes – just to get a baseline scan or a specialized consultation. If they experience a sudden side effect from chemotherapy at 2:00 AM, their local rural hospital may not have an oncology ward or the specific drugs needed to manage that complication. Their choices are constrained by geography, severe transportation barriers, weather limitations throughout the winter, and a lack of local medical infrastructure.
Now look at Patient B. They live in a dense, resource-heavy metropolitan area like the Greater Bay Area here in California. They are highly insured, and they happen to live just a few blocks away from a major, world-class academic research hospital. They have access to the latest clinical trials, a dedicated team of sub-specialists who see their specific mutation every day, an emergency room built specifically for cancer patients, and public transit or rideshares to get them to daily appointments without disrupting their family's income.
When a researcher builds a broad, un-sliced statistic, both of these individuals are placed into the exact same denominator. Their outcomes are added together, divided, and spit out as a single, neat average.
But what does that average actually tell us? It tells us nothing about reality. By lumping everyone together, the severe hardships, the logistical hurdles, the systemic barriers faced by the rural patient in Montana are completely hidden from view. Simultaneously, the immense structural and institutional advantages enjoyed by the urban patient in California are generalized as if they apply to everyone.
The broad percentage tells you an "average," but that average is a mathematical fiction. A flattened denominator creates a false sense of security for some, and unnecessary terror for others, because it completely masks the real structural, economic, and environmental drivers of health outcomes.
The real power of epidemiology, and the true promise of modern medicine, happens when we refuse to settle for flat averages. Power comes when we take that denominator and slice it thinner and thinner.
When we look at a denominator that isn't just a massive, terrifying category like "all lung cancer," but is instead restricted to a specific molecular or genetic mutation, a precise age bracket, a specific stage at diagnosis, and a distinct socioeconomic and geographic landscape—that is where population data stops being an abstract cloud of numbers and begins to mirror individual reality.
The more specific, refined, and contextual the denominator gets, the closer you get to true personalized medicine. It shifts the power dynamic back to you. It empowers you to sit in the doctor's office, look at a scary chart, and confidently ask your oncology team: "Does this statistic actually apply to my specific biological, geographical, and systemic situation, or am I looking at an average of a very broad and diverse group of people?"
When you learn to ask that question, you stop seeing yourself as a helpless percentage. You begin to see the variables that you can actually navigate, control, and advocate for.
Understanding this math is exactly how we move this podcast from a passive listening experience into an active model for change. We don't just talk about these pillars; we practice them together through data literacy:
• Learning: Together, we will actively learn by analyzing how these denominators are constructed so we can uncover the true trends and hidden disparities affecting our communities.
• Communicating: We will work as a community to discover and model better, clearer approaches to communication so that patients can ask their oncology teams the right questions about data.
• Empathy: We are going to engage with each other deeply to foster true empathy, ensuring we never let broad statistics flatten the unique, lived realities of individual patients.
• Policy: Ultimately, we will put our heads together to discuss systemic barriers and advocate for the structural policy changes that support all, focusing on those who need it most by targeting the specific groups hidden within the data averages.
Using data as a tool is incredibly powerful. It gives us vital context, maps out the systemic gaps in our society, and helps us advocate fiercely for ourselves, our families, and our neighbors.
But data should never be used to flatten our humanity. You are a whole person, with a specific life, a specific community, and a unique story. You are not a statistical average.
If you want to look closer at population trends, access resources, talk data, or if you simply want a quiet, supportive space to talk through how to navigate these heavy statistics without feeling completely overwhelmed, I want to invite you to join us on Patreon.
As I mentioned in our launch episode, this is a brand-new, entirely free community space designed specifically for us to work through this content together. There are no algorithms pushing outrage, no distractions, and no Facebook clutter—just a safe, direct way for us to connect, share our logistical hurdles, and learn from one another's expertise.
The link is right in the description below, and I would love to welcome you into our digital living room.
Thank you for being here, thank you for listening to The Epi Edit, and let's keep working together to change how we face this disease. I’ll see you in the community space.